


如何在报表中绘制 SVG 统计图
SVG 作为一种矢量图形,具有任意缩放不失真、可被高质量打印、文件较小、交互性强等优势,正逐渐成为一种主流的图片格式。润乾报表一方面可以生成 SVG 格式的统计图,另一方面也可以在 HTML5 中直接嵌入 SVG 统计图,方便用户在 PC 端或移动端查看。
下面通过一个示例说明润乾报表生成 SVG 统计图的过程。
制作报表
1、 连接数据源
打开润乾报表设计器,菜单栏选择工具 - 数据源,在弹出的数据源编辑窗口中新建数据源或连接现有数据源,这里使用默认的 demo 数据源。

2、 新建报表
菜单栏选择文件 - 新建报表,点击“生成空白报表”,新建一个空白报表。
3、设置数据集
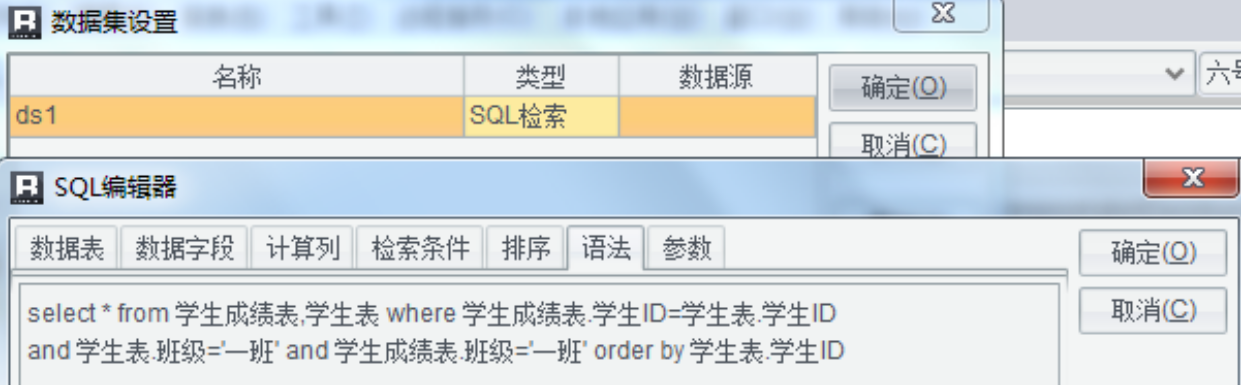
菜单栏选择报表 - 数据集,数据集类型选择“SQL 检索”,在弹出的 SQL 编辑器窗口中,选择“语法”页,输入查询 SQL 语句,也可以通过其他标签页的可视化界面进行字段选择、检索条件设置等。
4、编辑报表模板和表达式
在新建的报表模板中设置报表样式以及表达式:

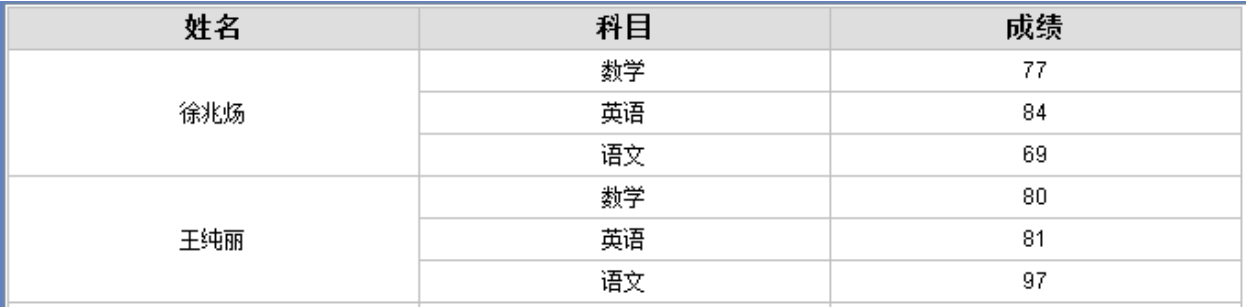
根据学生成绩表,按照姓名和科目分组,统计各个班级每个科目的平局成绩。预览结果(部分):
以上都是常规的报表制作步骤。
5、生成 SVG 统计图
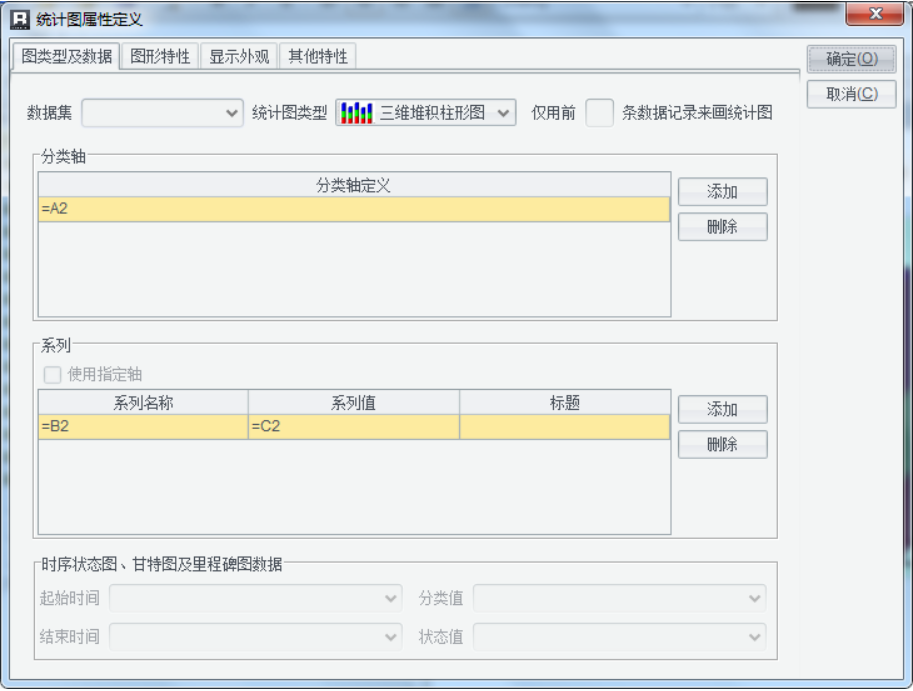
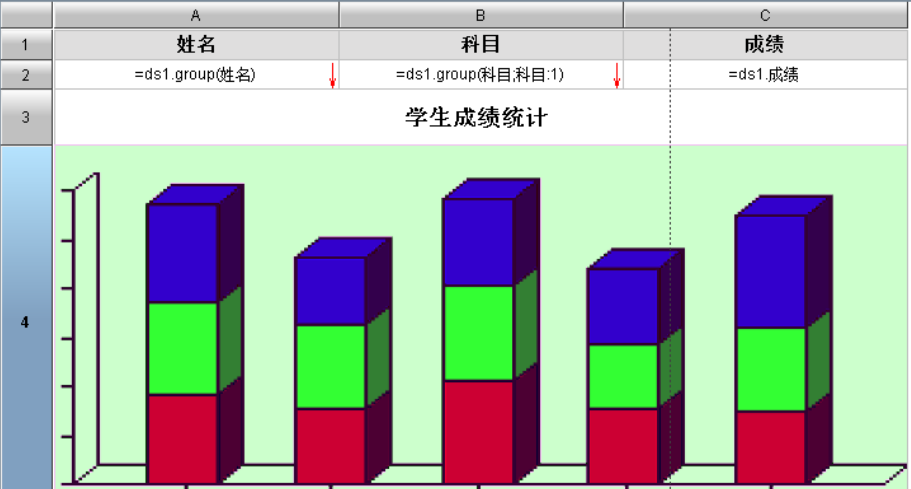
在上述模板中追加行,并设置合并格,右键 A4 格,选择“统计图”,统计图类型选择柱形图,分别设置分类轴和系列,如下图:
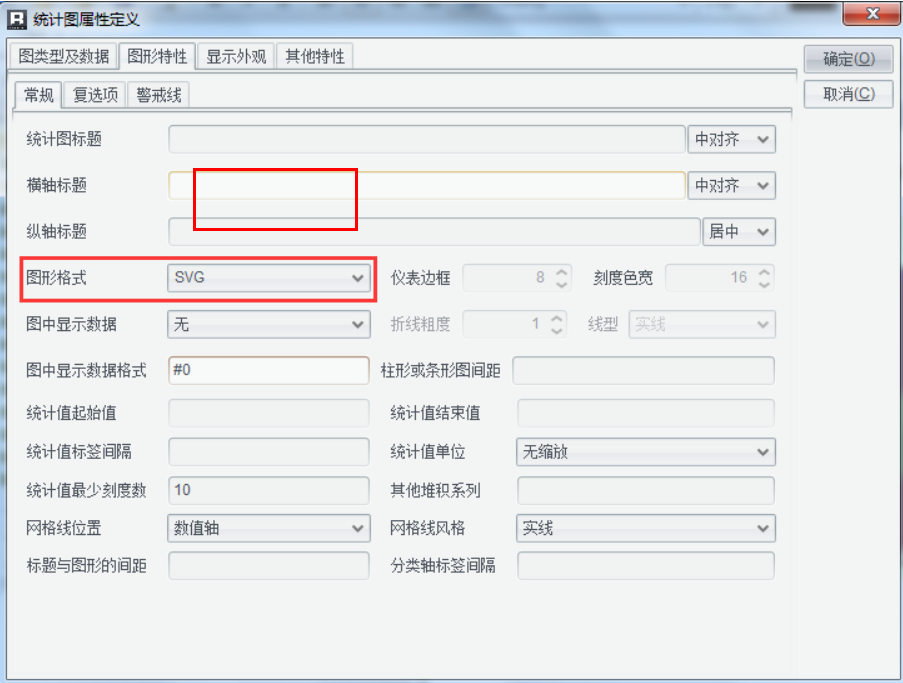
切换到“图形特性”选项卡,在图形格式中选择“SVG”格式,如下图:
设置完成后,报表模板及其表达式如下:
展现报表
在报表设计器中,选择工具栏中的“预览报表”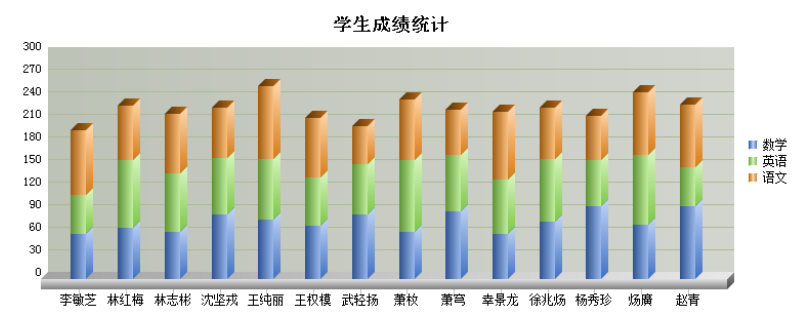
,即可在设计器中查看报表展现结果。
设计器预览效果
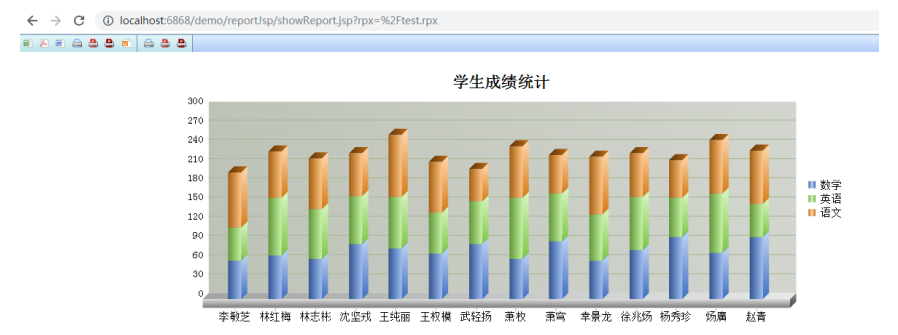
此外,润乾报表设计器内置了 Tomcat,允许用户将报表发布到 web 端查看页面效果,点击工具栏右上角的 IE 图标 ,设置报表主目录(可采用默认),完成报表发布。

chrome 中预览效果
另外,报表也可以在移动端浏览
(http://192.168.2.107:6868/demo/reportJsp/matchReport.jsp?rpx=test.rpx&match=1):
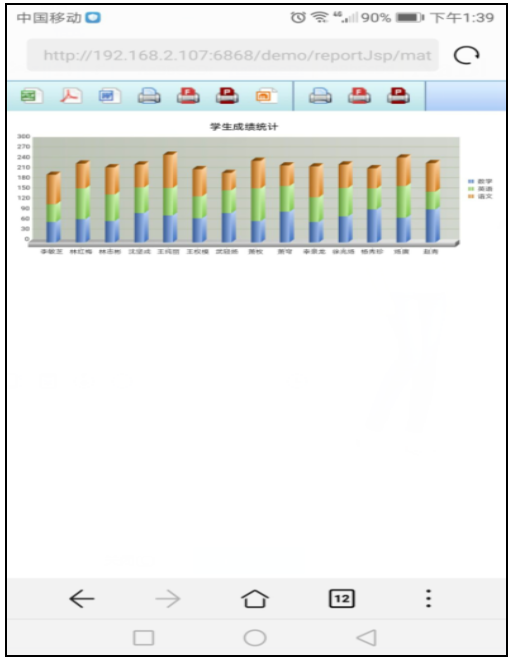
手机上查看效果
【附】PC 端自动生成的页面源代码(SVG 统计图的部分源码)
<tdcolSpan=4class="report1_6"><svgviewBox="0,0,748,277"width="748"height="277"xmlns:xlink="http://www.w3.org/1999/xlink"style="fill-opacity:1; color-rendering:auto; color-interpolation:auto; stroke:black; text-rendering:auto; stroke-linecap:square; stroke-miterlimit:10; stroke-opacity:1; shape-rendering:auto; fill:black; stroke-dasharray:none; font-weight:normal; stroke-width:1; font-family:'Dialog'; font-style:normal; stroke-linejoin:miter; font-size:12; stroke-dashoffset:0; image-rendering:auto;"xmlns="http://www.w3.org/2000/svg"

><!--Generated by the Batik Graphics2D SVG Generator--><defsid="genericDefs"

/><g

><defsid="defs1"

><linearGradientx1="690"gradientUnits="userSpaceOnUse"x2="694"y1="117"y2="117"id="linearGradient1"spreadMethod="reflect"

><stopstyle="stop-opacity:1; stop-color:rgb(185,112,52);"offset="0%"

/><stopstyle="stop-opacity:1; stop-color:rgb(252,218,190);"offset="100%"

/></linearGradient>

</defs><gstyle="fill:white; stroke:white;"

><rectx="0"width="748"height="275"y="0"style="stroke:none;"

/></g

><gstyle="stroke-linejoin:round; stroke-linecap:round; stroke-miterlimit:0.1;"

><rectx="686"width="44"height="48"y="113"style="fill:none;"

/><rectx="690"y="117"width="8"style="fill:url(#linearGradient1); stroke:none;"height="8"

/></g>

<polygonstyle="fill:url(#linearGradient71); stroke:none;"points=" 615 87 615 130 634 111 634 68"

/><polygonstyle="fill:none; stroke:rgb(1,1,1);"points=" 615 87 615 130 634 111 634 68"

/><polygonstyle="fill:url(#linearGradient72); stroke:none;"points=" 576 87 615 87 634 68 595 68"

/><polygonstyle="fill:none; stroke:rgb(1,1,1);"points=" 576 87 615 87 634 68 595 68"

/><rectx="576"y="87"width="39"style="fill:url(#linearGradient73); stroke:none;"height="43"

/><rectx="576"y="87"width="39"style="fill:none; stroke:rgb(1,1,1);"height="43"

/></g></g></svg>

</td>
从源码中可以看到润乾报表对 HTML5 的有效支持,客户在开发相关应用时可以直接使用润乾报表生成 SVG 统计图。
更多展现相关问题请查看:展现相关问题分类导航


👍